The SKOCH State of Governance methodology is designed to ensure a rigorous and multi-layered evaluation process that reflects both....
Figure 1: SKOCH State of Governance Index
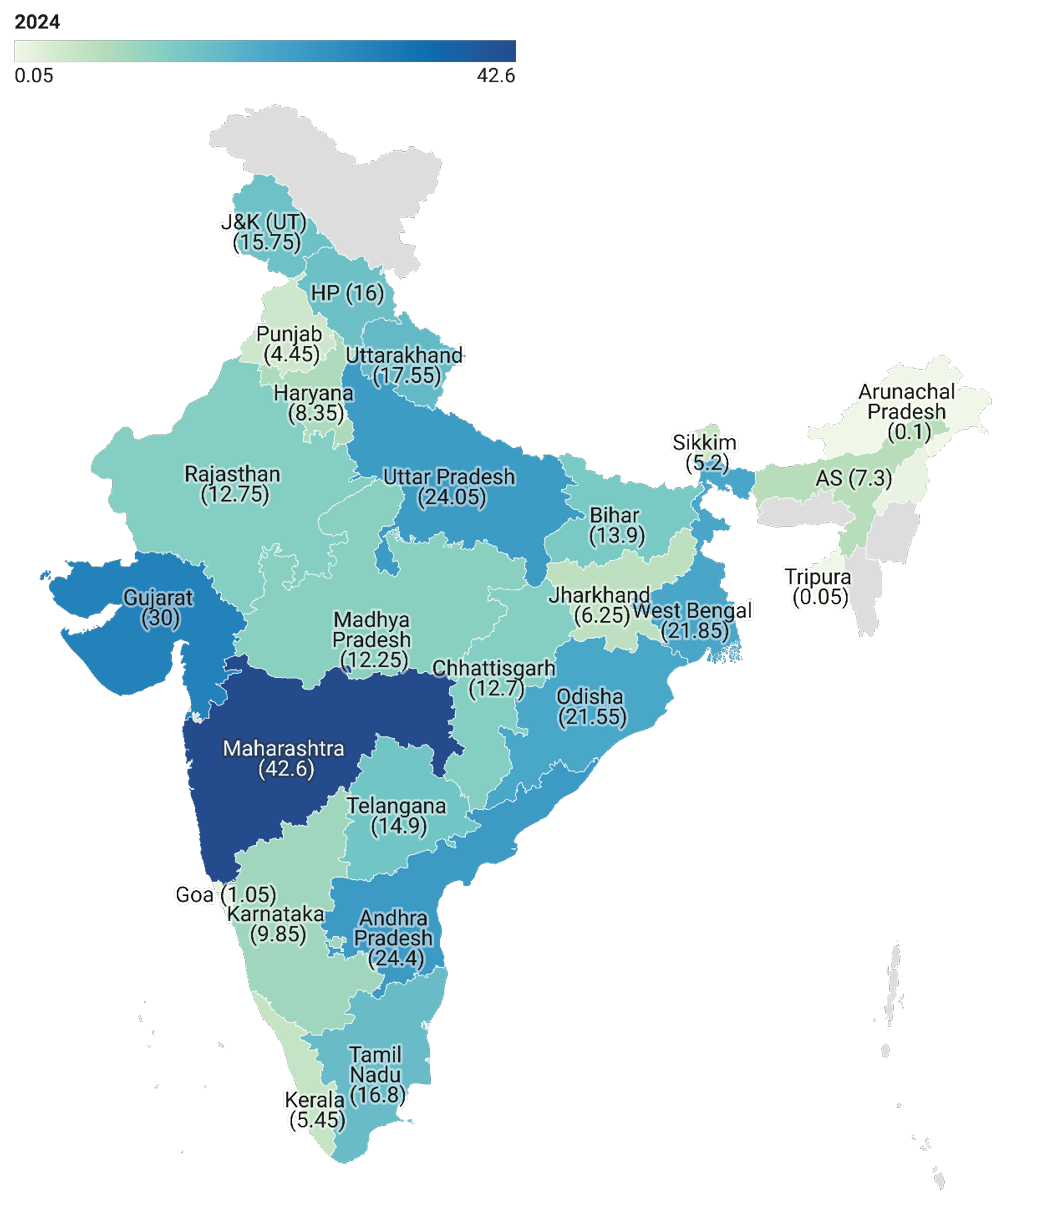
Disclaimer: Map not to scale. For representation only.
Figure 2: SKOCH State of Government Index (SoG) 2014-24
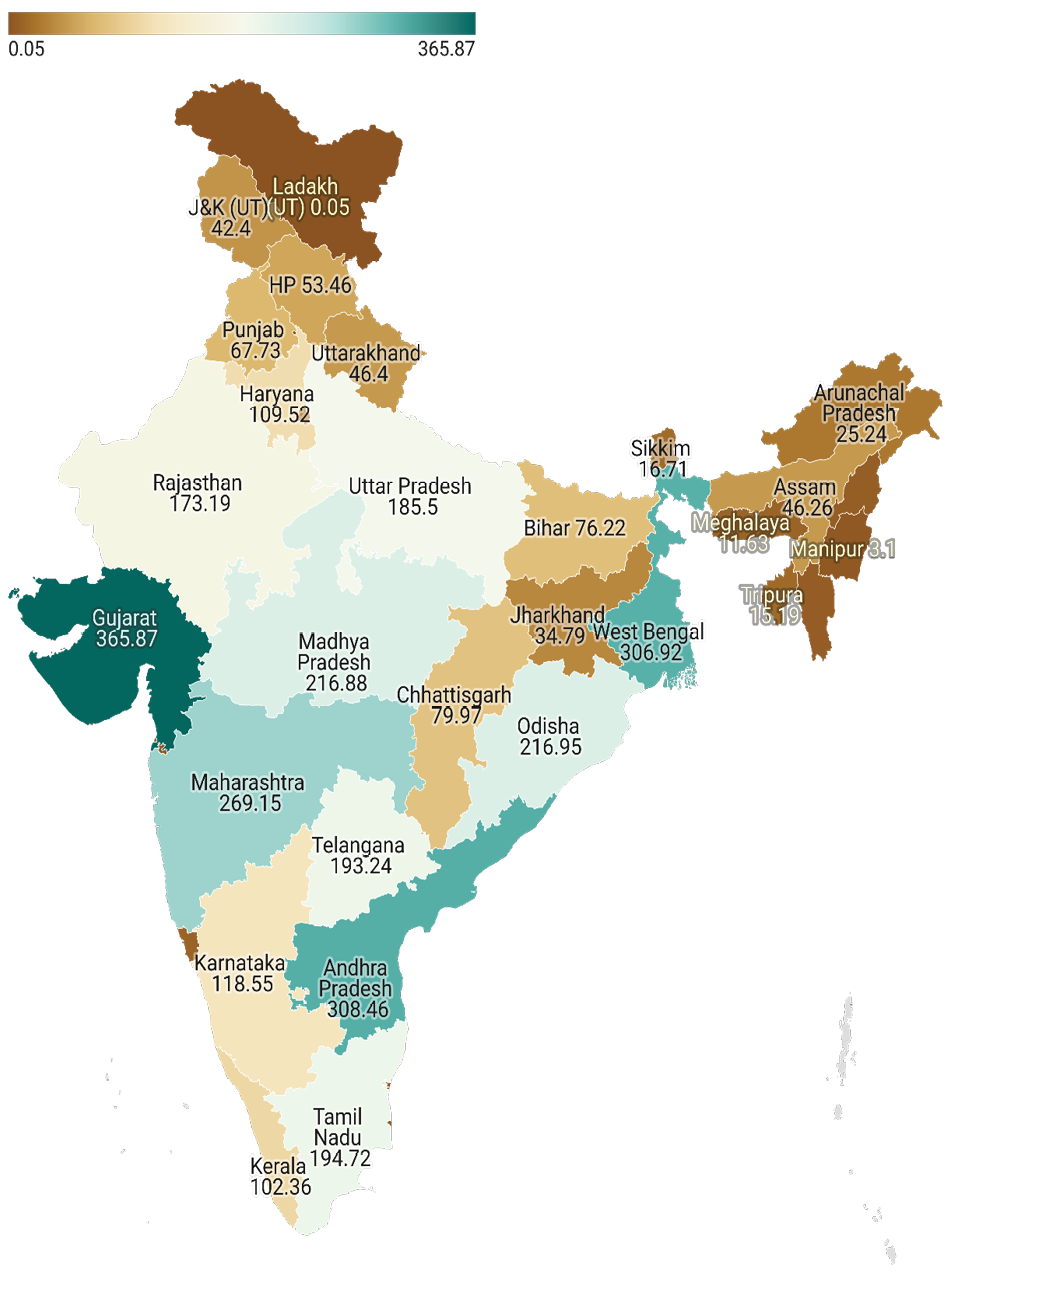
Disclaimer: Map not to scale. For representation only.
SKOCH State of Governance Index
Maharashtra clearly emerges as the frontrunner in the State of Governance Rankings, significantly outpacing other states in terms of both the quantity and quality of submitted projects. This reflects strong administrative responsiveness, innovative programme design, and a mature culture of documentation and impact assessment. Given the methodology’s emphasis on project vetting, peer evaluation, domain expert reviews, and field-level validation, Maharashtra’s top rank indicates that it not only initiates a large volume of governance interventions but also sustains them with measurable outcomes and replicable models. Its strong showing also suggests a high degree of internal accountability, practitioner engagement, and openness to third-party scrutiny—hallmarks of effective governance.
States like Gujarat, Andhra Pradesh, Uttar Pradesh, West Bengal, and Odisha follow as high performers, demonstrating a balanced mix of innovation, scalability, and impact in public service delivery. These states benefitted from the differentiated evaluation mechanism—where both new initiatives and ongoing programmes are assessed based on relevant criteria (impact vs. incremental improvement). Their ranks reflect consistent efforts to build institutional mechanisms that support transparent reporting, citizen engagement, and cross-sectoral policy integration. The methodology’s unique component of peer scoring appears to have benefitted states that actively collaborate and share best practices across departments, a trait particularly visible in Gujarat and Andhra Pradesh. States like Uttar Pradesh and Odisha, meanwhile, seem to have gained from project submissions in areas of scale and outreach, reinforcing the role of governance in large, diverse geographies.
Toward the lower end of the rankings, Karnataka, Kerala, Delhi, and several northeastern states appear to underperform—not necessarily due to the absence of good governance, but likely due to fewer project submissions or gaps in aligning documentation with evaluation criteria. The SKOCH methodology requires both qualitative substance and systematic presentation. States that either did not actively participate or did not tailor their submissions to reflect innovation, replicability, or stakeholder impact tend to score lower, despite having strong administrative systems. This highlights a key insight of the rankings: performance is not just a function of what states do, but also of how well they institutionalise a culture of outcome tracking, inter-departmental coordination, and learning from peers. These states have an opportunity to bridge the performance gap by investing in stronger project documentation, inter-agency visibility, and citizen feedback mechanisms. (Figure 1: SKOCH State of Governance Index)
Table 3: SKOCH State of Governance Rankings (2024)
| State(s) | SKOCH State of Governance Rankings (2024) | SKOCH State of Governance Score (2024) |
|---|---|---|
| Maharashtra | 1 | 42.6 |
| Gujarat | 2 | 30 |
| Andhra Pradesh | 3 | 24.4 |
| Uttar Pradesh | 4 | 24.05 |
| West Bengal | 5 | 21.85 |
| Odisha | 6 | 21.55 |
| Uttarakhand | 7 | 17.55 |
| Tamil Nadu | 8 | 16.8 |
| Himachal Pradesh | 9 | 16 |
| Jammu & Kashmir | 10 | 15.75 |
| Telangana | 11 | 14.9 |
| Bihar | 12 | 13.9 |
| Rajasthan | 13 | 12.75 |
| Chhattisgarh | 14 | 12.7 |
| Madhya Pradesh | 15 | 12.25 |
| Karnataka | 16 | 9.85 |
| Haryana | 17 | 8.35 |
| Assam | 18 | 7.3 |
| Jharkhand | 19 | 6.25 |
| Kerala | 20 | 5.45 |
| Sikkim | 21 | 5.2 |
| Punjab | 22 | 4.45 |
| Delhi | 23 | 3.1 |
| Nagaland | 24 | 1.1 |
| Goa | 25 | 1.05 |
| Arunachal Pradesh | 26 | 0.1 |
| Tripura | 27 | 0.05 |
Over the past decade, certain states have consistently emerged as top performers in the SKOCH State of Governance rankings (2014-24). Gujarat has led the way with a strong track record in implementing governance reforms, digitising public services, and building robust infrastructure. Andhra Pradesh and West Bengal have also shown sustained efforts in delivering development outcomes through administrative innovations and community-focused programmes. Maharashtra and Odisha round out the top tier, demonstrating effective governance in diverse areas such as rural development, social welfare, and financial management. These states exemplify how long-term institutional commitment, political will, and strategic prioritisation can result in meaningful progress. (Figure 2: SKOCH State of Government Index (SoG) 2014-24)
In contrast, several smaller states and Union Territories have registered limited activity or impact, reflecting capacity constraints, resource limitations, or lower levels of participation. Meanwhile, states like Bihar, Punjab, and Assam show moderate progress, with scope for deeper institutional reforms. Encouragingly, states such as Uttar Pradesh, Rajasthan, and Tamil Nadu have improved their governance performance in recent years, indicating that competitive federalism is prompting broader improvements. The overall picture reveals that governance excellence is not bound by geography or political ideology—it is driven by execution, innovation, and a willingness to reform.
Figure 1: SKOCH State of Governance Index
Disclaimer: Map not to scale. For representation only.
Figure 2: SKOCH State of Government Index (SoG) 2014-24
Disclaimer: Map not to scale. For representation only.
SKOCH State of e-Government Infrastructure Index
Haryana ranks first on the index not by chance, but due to a remarkable convergence of strong infrastructure and widespread digital service delivery. It boasts one of the highest internet and tele-density scores among large states, but what truly sets it apart is the massive lead in the number of e-services offered (304)—far exceeding all others—and a solid presence in e-transactions. Despite only modest scores in education and transaction per capita, its sheer service breadth demonstrates the effectiveness of digital governance rollout. In contrast, Uttarakhand, though second-ranked, owes its success to high e-transaction intensity and strong enrolment ratios, even with fewer digital services. This shows that smaller states with focused efforts can leverage existing infrastructure to drive citizen-centric adoption, validating the EGDI’s weighting of actual usage (OSI) over mere availability.
Mid-ranking states offer a mixed picture. Chhattisgarh makes a surprisingly strong showing due to very high e-transactions per capita (over 62,000), which compensates for relatively weak digital infrastructure. Likewise, Kerala performs well due to its strong broadband penetration and tele-density, though its middling score in e-transaction intensity suggests that digital services are underleveraged despite strong access. Gujarat and Maharashtra, traditionally seen as digitally forward, underperform due to low e-transaction volumes relative to population and fewer digital services. This reflects a gap not in infrastructure investment but in last-mile adoption and transactional integration—proving that hardware alone does not translate into e-governance maturity.
States like Bihar, Odisha, Assam, and Rajasthan rank low due to lower scores across all three pillars—low internet density, below-average enrolment rates, and negligible e-transactions per 100 population. Bihar, for instance, has one of the weakest infrastructure scores and limited citizen interaction with digital platforms. Even where infrastructure exists, low service provisioning and poor uptake limit their overall index performance. These findings underscore a key lesson from the EGDI methodology: digital governance success hinges not just on digital capacity, but on service design, relevance, and institutional push to drive usage. High-scoring states achieve alignment across infrastructure, human capital, and delivery, while low performers lag due to fragmented, underutilised systems. (Figure 3: SKOCH State of e-Government Infrastructure Index)
Table 4: SKOCH State of E-Government Infrastructure Index
| State(s) | State of E-Government Infrastructure Index | State of E-Government Infrastructure Index Score |
|---|---|---|
| Haryana | 1 | 0.71 |
| Meghalaya | 2 | 0.545 |
| Mizoram | 3 | 0.483 |
| Uttarakhand | 4 | 0.465 |
| Punjab | 5 | 0.453 |
| Delhi (UT) | 6 | 0.449 |
| Jammu & Kashmir (UT) | 7 | 0.399 |
| Kerala | 8 | 0.397 |
| Chhattisgarh | 9 | 0.396 |
| Himachal Pradesh | 10 | 0.388 |
| Goa | 11 | 0.385 |
| West Bengal | 12 | 0.339 |
| Lakshdweep (UT) | 13 | 0.336 |
| Chandigarh (UT) | 14 | 0.329 |
| Madhya Pradesh | 15 | 0.326 |
| Telangana | 16 | 0.324 |
| Karnataka | 17 | 0.306 |
| Tripura | 18 | 0.305 |
| Andaman & Nicobar Islands (UT) | 19 | 0.304 |
| Tamil Nadu | 20 | 0.302 |
| Gujarat | 21 | 0.279 |
| Maharashtra | 22 | 0.273 |
| Ladakh (UT) | 23 | 0.269 |
| Manipur | 24 | 0.26 |
| Sikkim | 25 | 0.237 |
| Andhra Pradesh | 26 | 0.228 |
| Jharkhand | 27 | 0.227 |
| Assam | 28 | 0.218 |
| Uttar Pradesh | 29 | 0.214 |
| Arunachal Pradesh | 30 | 0.204 |
| Puduchery (UT) | 31 | 0.183 |
| Rajasthan | 32 | 0.18 |
| Odisha | 33 | 0.179 |
| Nagaland | 34 | 0.178 |
| Dadra and Nagar Haveli (UT)* | 35 | 0.178 |
| Bihar | 36 | 0.135 |
SKOCH State of Financial Prudence Index
Odisha, Maharashtra, and Gujarat lead the State of Financial Prudence Index with a strong convergence of fiscal prudence, revenue strength, and investment in development. Odisha tops the index largely due to its exceptionally high own non-tax revenue, the highest development expenditure-to-GSDP ratio, and a solid capital outlay score. Maharashtra, despite its size, maintains low debt and deficit ratios and demonstrates exceptional revenue-generating capacity. Gujarat similarly benefits from a low fiscal deficit, low debt, and high own revenue collection. These top-ranking states exemplify the methodological emphasis of the index: long-term sustainability (debt and deficit), fiscal autonomy (own revenues), and prioritisation of development and infrastructure spending.
Middle-ranking states such as Tamil Nadu, Telangana, Karnataka, and Jharkhand exhibit balanced fiscal profiles with modest deficits, relatively strong own-revenue bases, and consistent investment in capital outlays. Tamil Nadu performs particularly well due to its diversified revenue streams and high own non-tax revenue, even if its capital spending is comparatively low. Telangana’s strength lies in its strong own revenue mix and decent debt management, while Jharkhand surprises with robust capital spending and low debt, despite weaker own-tax revenues. These states demonstrate how moderate performance across all indicators, especially on development and capital expenditure, can yield strong composite scores. They also highlight the importance of institutional efficiency, as seen in Jharkhand’s high pendency score, which rewards efficient administrative performance.
At the lower end, Himachal Pradesh, Bihar, Arunachal Pradesh, and Punjab present worrying signs of fiscal stress. Himachal’s very high debt and pendency levels, combined with poor revenue mobilisation, severely drag down its score. Bihar has weak own-revenue capacity and low capital outlay, despite a decent share of development expenditure. Arunachal Pradesh has the highest development spending (as % of GSDP) but is dragged down by near-zero own revenue generation, making it dependent on central transfers. Punjab, with the highest debt burden among large states (46.7% of GSDP) and low capital investment, reflects a structural crisis in fiscal sustainability. These findings reiterate the index’s value: states with poor revenue mobilisation and high legacy costs (e.g., debt servicing) are penalised, even if they perform reasonably on development metrics. Fiscal health, as captured by this index, is not just about spending more, but about doing so sustainably and efficiently. (Figure 4: SKOCH State of Financial Prudence Index)
Table 5: SKOCH State of Financial Prudence Index
| State(s) | SKOCH State of Financial Prudence Index | SKOCH State of Financial Prudence Index Score |
|---|---|---|
| Odisha | 1 | 0.643 |
| Maharashtra | 2 | 0.64 |
| Gujarat | 3 | 0.589 |
| Tamil Nadu | 4 | 0.527 |
| Telangana | 5 | 0.515 |
| Karnataka | 6 | 0.507 |
| Jharkhand | 7 | 0.506 |
| Uttar Pradesh | 8 | 0.496 |
| Madhya Pradesh | 9 | 0.466 |
| Uttarakhand | 10 | 0.446 |
| Manipur | 11 | 0.428 |
| Meghalaya | 12 | 0.424 |
| Rajasthan | 13 | 0.424 |
| Assam | 14 | 0.413 |
| Tripura | 15 | 0.406 |
| Haryana | 16 | 0.403 |
| Andhra Pradesh | 17 | 0.397 |
| Chhattisgarh | 18 | 0.396 |
| Kerala | 19 | 0.375 |
| Mizoram | 20 | 0.371 |
| Sikkim | 21 | 0.37 |
| Goa | 22 | 0.366 |
| West Bengal | 23 | 0.364 |
| Nagaland | 24 | 0.334 |
| Punjab | 25 | 0.309 |
| Arunachal Pradesh | 26 | 0.296 |
| Jammu & Kashmir | 27 | 0.278 |
| Bihar | 28 | 0.259 |
| Himachal Pradesh | 29 | 0.184 |
SKOCH State of Government Transformation Index
Odisha, Maharashtra, and Gujarat lead the State of Financial Prudence Index with a strong convergence of fiscal prudence, revenue strength, and investment in development. Odisha tops the index largely due to its exceptionally high own non-tax revenue, the highest development expenditure-to-GSDP ratio, and a solid capital outlay score. Maharashtra, despite its size, maintains low debt and deficit ratios and demonstrates exceptional revenue-generating capacity. Gujarat similarly benefits from a low fiscal deficit, low debt, and high own revenue collection. These top-ranking states exemplify the methodological emphasis of the index: long-term sustainability (debt and deficit), fiscal autonomy (own revenues), and prioritisation of development and infrastructure spending.
Maharashtra, which leads the Transformation Index, exemplifies how strategic investment in infrastructure and industrial-friendly policies can drive substantial economic transformation. Gujarat closely follows, credited to its consistent attraction of investments and robust entrepreneurial ecosystem, underpinned by efficient governance. Andhra Pradesh and Uttar Pradesh’s strong performances indicate tangible efforts in governance reforms and industrial growth. Meanwhile, West Bengal and Uttarakhand reflect significant structural shifts positively influencing socio-economic outcomes.
However, challenges remain. States like Odisha, Tamil Nadu, Himachal Pradesh, and J&K, despite improvements, struggle to fully capitalise on their potential due to lingering governance or infrastructural constraints. Madhya Pradesh and Karnataka, traditionally robust economic hubs, surprisingly lag in structural transformation, suggesting a need for intensified policy reforms. Lower-ranked states such as Bihar, Assam, and Jharkhand face persistent barriers in infrastructure development. Northeastern states, constrained by geographic and infrastructural limitations, also exhibit slower transformational progress. Delhi and Goa, despite inherent economic advantages, highlight significant execution gaps.(Figure 5: SKOCH State of Government Transformation Index)
Table 6: SKOCH State of Government Transformation Index
| State(s) | SKOCH State of Government Transformation Index | SKOCH State of Government Transformation Index Score |
|---|---|---|
| Maharashtra | 1 | 0.637 |
| Gujarat | 2 | 0.491 |
| Haryana | 3 | 0.453 |
| Uttarakhand | 4 | 0.438 |
| West Bengal | 5 | 0.426 |
| Andhra Pradesh | 6 | 0.4 |
| Uttar Pradesh | 7 | 0.389 |
| Jammu & Kashmir | 8 | 0.384 |
| Himachal Pradesh | 9 | 0.381 |
| Tamil Nadu | 10 | 0.348 |
| Chhattisgarh | 11 | 0.347 |
| Odisha | 12 | 0.342 |
| Telangana | 13 | 0.337 |
| Madhya Pradesh | 14 | 0.306 |
| Punjab | 15 | 0.278 |
| Karnataka | 16 | 0.268 |
| Kerala | 17 | 0.262 |
| Delhi | 18 | 0.26 |
| Rajasthan | 19 | 0.239 |
| Bihar | 20 | 0.23 |
| Goa | 21 | 0.204 |
| Assam | 22 | 0.194 |
| Jharkhand | 23 | 0.186 |
| Sikkim | 24 | 0.179 |
| Tripura | 25 | 0.153 |
| Arunachal Pradesh | 26 | 0.103 |
| Nagaland | 27 | 0.101 |
SKOCH State of Government Efficiency Index
Maharashtra is the undisputed leader in the State of Government Efficiency Index, driven by an exceptional combination of top-tier governance innovation and fiscal discipline. It not only ranks first in governance initiatives—due to its strong documentation, implementation maturity, and outcome validation—but also shows robust fiscal metrics such as low debt, high own-revenue generation, and prudent deficit management. Gujarat and Odisha follow, benefiting from strong fiscal sustainability, especially Gujarat’s low debt-GSDP ratio and revenue autonomy, and Odisha’s high development expenditure and non-tax revenue mobilisation. These top-performing states exemplify what the index is designed to capture: governance outcomes that are not just impactful but cost-effective, sustainable, and replicable.
Middle-tier performers like Andhra Pradesh, Uttar Pradesh, Tamil Nadu, Telangana, and West Bengal present a more mixed picture. Andhra Pradesh and Uttar Pradesh score relatively lower in governance rankings but are pulled up by moderate to strong fiscal performance—Uttar Pradesh in particular benefits from high own-tax revenue and steady capital outlay. Tamil Nadu and Telangana have diversified revenue bases and stable finances, but their governance scores are middling due to limited project documentation or outreach. This reinforces the index’s core methodological insight: efficiency is not about excelling in one dimension—it requires coordination between administrative effectiveness and fiscal prudence. States that balance medium performance across both pillars tend to outperform those excelling in one but faltering in the other.
At the lower end of the index, states like Himachal Pradesh, Punjab, Goa, Arunachal Pradesh, and Tripura perform poorly due to simultaneous weaknesses in fiscal health and governance project pipeline. Himachal and Punjab suffer from high debt levels and poor revenue mobilisation, while their governance submissions remain sparse or insufficiently evaluated. Kerala and Karnataka, despite being relatively well-administered, rank low due to weak fiscal indicators like low capital outlay and high pendency. These results show that strong governance narratives must be backed by hard fiscal fundamentals to sustain outcomes. The index sends a clear message: fiscal recklessness or administrative opacity—either can undermine state-level efficiency, and success in India’s federal structure depends on striking a durable balance between doing more and spending wisely. (Figure 6: SKOCH State of Government Efficiency Index)
Table 7: SKOCH State of Government Efficiency Index
| State(s) | SKOCH State of Government Efficiency Index | SKOCH State of Government Efficiency Index Score |
|---|---|---|
| Maharashtra | 1 | 0.82 |
| Gujarat | 2 | 0.646 |
| Odisha | 3 | 0.574 |
| Uttar Pradesh | 4 | 0.53 |
| Andhra Pradesh | 5 | 0.485 |
| Tamil Nadu | 6 | 0.46 |
| West Bengal | 7 | 0.438 |
| Telangana | 8 | 0.432 |
| Uttarakhand | 9 | 0.429 |
| Madhya Pradesh | 10 | 0.376 |
| Karnataka | 11 | 0.369 |
| Rajasthan | 12 | 0.361 |
| Chhattisgarh | 13 | 0.347 |
| Jharkhand | 14 | 0.326 |
| Jammu & Kashmir (UT) | 15 | 0.323 |
| Haryana | 16 | 0.299 |
| Bihar | 17 | 0.292 |
| Assam | 18 | 0.292 |
| Himachal Pradesh | 19 | 0.279 |
| Kerala | 20 | 0.251 |
| Sikkim | 21 | 0.246 |
| Punjab | 22 | 0.206 |
| Tripura | 23 | 0.203 |
| Goa | 24 | 0.195 |
| Nagaland | 25 | 0.179 |
| Arunachal Pradesh | 26 | 0.149 |
SKOCH State of Development Index
Maharashtra decisively leads the Development Index, showcasing consistent leadership across governance execution, fiscal strength, and digital infrastructure. Its top rank is not merely reflective of resource availability but of a well-calibrated administrative machine that delivers impact-driven projects (as seen in governance rankings), robust revenue mobilisation, and stable fiscal management. This reinforces the logic of the composite index: development is not an outcome of isolated reforms but the alignment of institutional effectiveness, financial prudence, and digital readiness. Following Maharashtra, Gujarat and Odisha also rank high—Gujarat with its stellar fiscal discipline and Odisha with its unmatched non-tax revenue mobilisation and digital transaction volumes, proving that diverse models of governance can deliver high composite development outcomes.
Uttarakhand, Haryana, and Uttar Pradesh form a strong second tier. Their ranks reflect how focused governance programmes, when paired with a steady push for digital services and reasonably healthy fiscal conduct, translate into above-average development outcomes. Uttarakhand’s high rank is especially notable considering its geography and population constraints, indicating that even smaller states can achieve development leadership through targeted digitisation and effective fiscal decentralisation. Uttar Pradesh, while still grappling with governance gaps, scores well due to strong tax performance and a large-scale digital public infrastructure rollout, highlighting the potential of large states to turn scale into strength.
Tamil Nadu, West Bengal, Andhra Pradesh, and Telangana illustrate development models driven by decent administrative execution and competent financial management, but each with distinctive constraints. Tamil Nadu and Telangana have relatively advanced service delivery systems yet slightly underperform on digital intensity metrics. West Bengal’s governance and fiscal blend carries it forward, while Andhra Pradesh maintains balance without excelling in any single domain. These states reflect the strength of mid-spectrum performers who, despite not topping individual indices, accumulate gains across pillars to ensure composite progress—validating the importance of the equal-weighted methodology.
States like Karnataka, Himachal Pradesh, Rajasthan, and Kerala reflect a paradox: good governance or social indicators alone are insufficient for development leadership if not matched with fiscal innovation and digital expansion. Karnataka, despite being a tech hub, underperforms in finance-driven indicators. Himachal and Kerala lag due to low own revenue mobilisation and high institutional pendency, even though their social infrastructure remains strong. Rajasthan’s middling rank shows consistent but unremarkable performance across all three dimensions. These states exemplify how strong legacy sectors need to be complemented by forward-looking reforms in digital and financial governance to convert capacity into composite development. (Figure 7: State of Development Index)
The lower-ranked states—Jharkhand, Punjab, Assam, Goa, Sikkim, Bihar, Tripura, Nagaland, and Arunachal Pradesh—present varied challenges. While some (e.g., Goa, Sikkim) struggle due to governance under-reporting or narrow fiscal bases, others like Punjab and Bihar are weighed down by legacy debt, low own-tax revenue, and weak digital service uptake. Arunachal and Nagaland, despite high development spending, fail to convert this into effective outcomes due to limited digital capacity and institutional inefficiency. These states highlight the core insight of the Development Index: money spent does not equal development delivered unless supported by institutional strength, digital public goods, and financial sustainability.
Table 8: SKOCH State of Development Index
| State(s) | SKOCH State of Development Index | SKOCH State of Development Index Score |
|---|---|---|
| Maharashtra | 1 | 1.913 |
| Gujarat | 2 | 1.572 |
| Odisha | 3 | 1.327 |
| Uttarakhand | 4 | 1.322 |
| Haryana | 5 | 1.308 |
| Uttar Pradesh | 6 | 1.274 |
| Tamil Nadu | 7 | 1.223 |
| West Bengal | 8 | 1.215 |
| Andhra Pradesh | 9 | 1.197 |
| Telangana | 10 | 1.188 |
| Chhattisgarh | 11 | 1.089 |
| Madhya Pradesh | 12 | 1.079 |
| Jammu & Kashmir (UT) | 13 | 1.046 |
| Karnataka | 14 | 1.043 |
| Himachal Pradesh | 15 | 0.947 |
| Rajasthan | 16 | 0.902 |
| Kerala | 17 | 0.899 |
| Jharkhand | 18 | 0.879 |
| Punjab | 19 | 0.865 |
| Assam | 20 | 0.801 |
| Goa | 21 | 0.775 |
| Sikkim | 22 | 0.728 |
| Bihar | 23 | 0.719 |
| Tripura | 24 | 0.711 |
| Nagaland | 25 | 0.537 |
| Arunachal Pradesh | 26 | 0.501 |
INCLUSION is the first and only journal in the country that champions the cause of social, financial and digital inclusion. With a discernable and ever-increasing readership, the quarterly relentlessly pursues the three inclusions through its rich content comprising analysis, reportage, features, interviews, grassroots case studies and columns by domain experts. The magazine caters to top decision makers, academia, civil society, policy makers and industry captains across banking, financial services and insurance.
Previous

Read More
Next
Read More
The radar chart below provides a comparative visualisation of the top five....
Would you like to share your thoughts?
Your email address will not be published. Required fields are marked *