SKOCH State of Governance Index
The SKOCH State of Governance methodology is designed to ensure a rigorous and multi-layered evaluation process that reflects both the quality and impact of governance initiatives across Indian states. It begins with states submitting their best-performing projects for evaluation. These projects undergo an initial round of vetting and shortlisting conducted by SKOCH’s team of research analysts, who assess their relevance, documentation, and alignment with governance goals. The shortlisted projects then move to the first level of primary evaluation, where a jury comprising three domain experts assesses them for innovation, scalability, replicability, and efficiency.
To ensure a differentiated and nuanced assessment, the methodology categorises projects into two types: new projects and ongoing ones. For new projects, the focus is on measuring the overall impact created, while for ongoing projects, the emphasis is on evaluating incremental improvement over time. This distinction allows for a fair comparison of initiatives at different stages of maturity. Simultaneously, a unique peer evaluation process is carried out, wherein project owners or officials working on similar themes evaluate each other’s work, thus introducing practitioner-level scrutiny into the scoring process.
Based on the cumulative average score from these evaluations, a cut-off is determined, and a second shortlist of high-performing projects is prepared. These projects are then subject to field research, where SKOCH analysts conduct on-the-ground assessments to verify outcomes and gauge impact by engaging with beneficiaries and stakeholders. Additionally, to incorporate public perception, a popular vote is conducted exclusively among registered users on SKOCH’s platform, ensuring a credible and participatory layer of citizen feedback.
Projects that meet the cut-off move to the semi-final stage. These merit-listed projects participate in exhibitions and live polling, where they garner expert votes, which contribute to the final scoring. Each project receives a comprehensive score that combines domain expert evaluation, peer review, field feedback, and public and expert voting. The aggregation of these scores determines both sectoral rankings and the overall State of Governance performance. States are then classified into four categories—STARS (top performers), PERFORMERS (commendable work), CATCHING UP (significant efforts), and OTHERS—ensuring a transparent, comparative, and outcome-based framework.
SKOCH State of e-Government Infrastructure Index
The State of E-Government Infrastructure Index is constructed using a robust and statistically grounded methodology that captures the multidimensional aspects of digital governance readiness across Indian states and union territories. The framework rests on three core pillars—Telecommunication Infrastructure Index (TII), Human Capital Index (HCI), and Online Services Index (OSI)—each of which reflects a crucial component of digital infrastructure and capability. These indicators are carefully selected to assess the capacity for digital access, the foundational human capability to use digital tools, and the actual utilisation of digital public services.
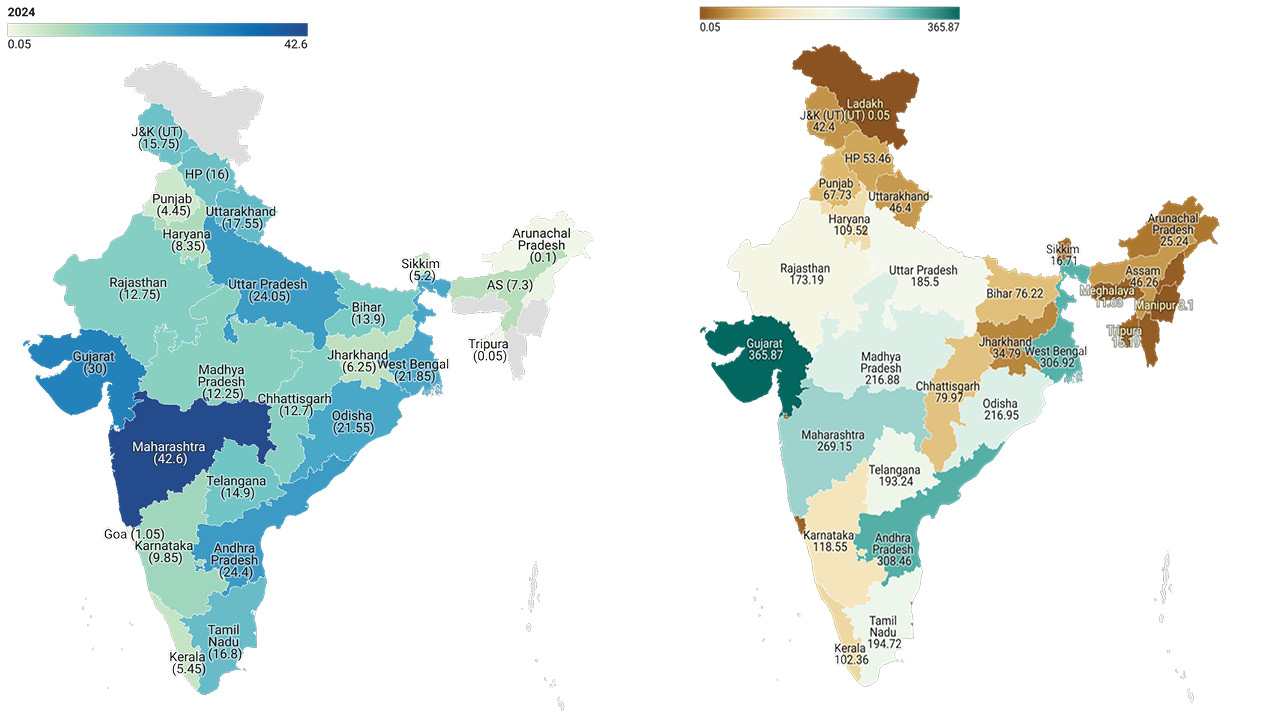
The Telecommunication Infrastructure Index (TII) is composed of two critical sub-indicators: the number of internet subscribers per 100 population and the state/UT-wise total tele-density. These capture both the availability and penetration of internet and telecom services, which form the backbone of any e-governance ecosystem. The Human Capital Index (HCI) is based on the gross enrolment ratio (%) in elementary education, representing the population’s baseline digital readiness. The Online Services Index (OSI) reflects the extent of actual digital governance utilisation, measured through the number of e-transactions per 100 population, providing insight into how frequently digital public services are accessed and used.
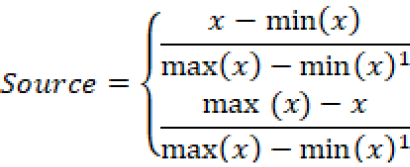
To ensure statistical robustness and comparability, each of the three indicators undergoes Z-score standardisation, a method that normalises raw data by adjusting for mean and standard deviation. This process ensures that indicators with naturally higher dispersion do not disproportionately influence the overall score. The Z-score transformation—calculated as X_new = (x – μ) / σ—enables the three indices to exhibit comparable variance, making the composite index statistically balanced. Without this step, the final E-Governance Development Index (EGDI) would be skewed toward the indicator with the greatest spread, distorting true state-level performance.
After standardisation, the EGDI is calculated using a weighted average: ¼ weight each for TII and HCI, and ½ weight for OSI, reflecting the relative importance of actual service delivery in measuring governance performance. This weighting approach, combined with the prior normalisation, allows for an equitable, variance-adjusted aggregation of the three pillars. Additionally, the number of e-services available in each state acts as a supplementary indicator to contextualise performance and identify service availability gaps. The end result is a composite, methodologically sound index that reliably ranks states based on their digital governance infrastructure and readiness.
The State of E-Government Infrastructure Index serves as a vital diagnostic tool for policymakers, administrators, and technologists seeking to strengthen the digital backbone of governance. By tracking state-wise disparities and improvements across core digital indicators, the Index offers granular insights into where investments in connectivity, education, or digital service delivery are most needed. This becomes particularly important as the government rolls out Digital India initiatives and citizen-facing platforms such as DigiLocker, UMANG, and the National Digital Health Mission. The EGDI thus helps assess not just infrastructure availability but also the effective reach and uptake of these platforms, ensuring that digital governance is inclusive, responsive, and continuously improving.
What makes this methodology especially India-centric is its alignment with the country’s unique development context. Unlike global indices that may emphasise indicators such as broadband affordability or open data policies, this framework roots itself in India’s federal realities—where states vary significantly in education levels, digital penetration, and service delivery models. By incorporating metrics such as e-transactions per 100 population and gross enrolment ratio in elementary education, the Index captures both infrastructural and human capacity dimensions that are relevant to India’s stage of digital development. Furthermore, the emphasis on tele-density and internet subscribers per 100 population acknowledges the mobile-first nature of India’s digital ecosystem, making the Index both grounded in local realities and scalable over time.
SKOCH State of Financial Prudence Index
Public finance theory shows the centrality of prudent debt management in achieving sustainable economic growth (Musgrave, 1959; Blanchard & Fischer, 1989)27&28. Excessive indebtedness constrains a government’s fiscal space, forcing the diversion of resources toward debt servicing rather than productive investments in health, education, or infrastructure. When debt levels soar, governments lose policy flexibility and face higher borrowing costs, ultimately compromising macroeconomic stability and long-run development prospects. These ideas align with classic arguments that fiscal sustainability is a precondition for maintaining both investor confidence and economic equilibrium.
Another key pillar of public finance is effective revenue generation, with Musgrave (1959) highlighting that stable and equitable tax systems form the backbone of government operations. A weak revenue base not only endangers the ability to fund essential services but also amplifies vulnerability to economic shocks, as governments may be forced to resort to ad hoc borrowing or abrupt expenditure cuts. Revenue challenges are especially pronounced during periods of cyclical downturns or external disruptions, underscoring the need for robust, diversified revenue streams that can adapt to changing economic conditions.
Beyond debt and revenue considerations, scholars have increasingly emphasised the importance of governance quality and institutional frameworks in shaping fiscal outcomes (Lin & Liu, 2000)29. Efficient administrative and judicial systems foster trust, lower transaction costs, and improve contract enforcement. In contrast, weak institutions characterised by judicial backlogs and slow administrative procedures can deter investment, impede business operations, and inflate public costs. Consequently, governance quality is not an isolated concern; it intricately influences a state’s fiscal health and its broader economic trajectory.
Building on these theoretical perspectives, the present methodology consolidates seven core indicators into a single composite State of Financial Prudence Index. This approach enables policymakers to assess multiple dimensions of a state’s fiscal position, including debt levels, deficit management, revenue sources, development spending, capital outlays, and institutional efficiency, in a unified framework. Synthesisation of these variables into a single measure will help decision makers to gain a more holistic perspective on strengths and weaknesses, informing targeted reforms and strategic resource allocation. Through such a multifaceted analysis, states can deal with fiscal challenges more effectively while laying a foundation for inclusive and durable economic growth.
Indicators for State of Financial Prudence Index
The State of Financial Prudence Index uses seven indicators to assess the fiscal health of the states. First, the debt-GSDP ratio measures total outstanding debt relative to Gross State Domestic Product (GSDP). It reflects long-term fiscal sustainability, as excessive debt can crowd out public expenditures for growth-enhancing activities, aligning with the “debt overhang” theory in public finance (Blanchard & Fischer, 1989).
Gross Fiscal Deficit (GFD)-GSDP Ratio expresses the shortfall between revenues and expenditures as a percentage of GSDP. High deficits indicate reliance on borrowing, potentially leading to higher interest burdens and vulnerability to capital market fluctuations.
Own Tax Revenue (% of total revenue) represents the total revenue collected from taxation, such as sales tax and excise duties, in absolute terms. It reflects fiscal autonomy and efficiency in tax administration. Musgrave (1959) argued that diversified, stable tax revenues are integral to equitable and efficient resource allocation.
Own Non-Tax Revenue (% of total revenue) captures the revenue generated from sources other than taxes, including fees, royalties, and user charges. This metric indicates alternative revenue streams that reduce dependence on central transfers and expand the fiscal base, thereby enhancing resilience to economic downturns.
Development Expenditure-GSDP Ratio is the ratio of developmental spending, encompassing areas like health, education, and agriculture to GSDP. It reflects the priority placed on human capital formation and long-term economic welfare, consistent with endogenous growth theories that emphasise productive government spending (Barro, 1990)30.
Capital Outlay-GSDP Ratio represents the ratio of capital investments in infrastructure projects such as roads, power, and transport to GSDP. This measure aligns with the view that public infrastructure investments stimulate productivity and private sector growth (Aschauer, 1989)31.
Per Capita Pendency Rate is a governance metric indicating the efficiency of judicial or administrative processes, measured by the number of pending cases or unresolved issues relative to the population. Low pendency signals effective institutions, which reduce transaction costs and improve the business climate (Lin & Liu, 2000). Institutional quality is a key dimension of fiscal performance, as inefficient governance can undermine public trust and investment.
Weights: This methodology groups indicators into three broad dimensions—Fiscal Sustainability & Prudence (40%), Revenue-Generating Capacity (30%), and Development & Investment Prioritisation (30%)—and assigns the following weights:
for positively desired indicators (Own Tax Revenue, Own Non-Tax Revenue, Dev. Exp./GSDP, Cap. Outlay/GSDP)
for inversely desired indicators (Debt-GSDP, GFD-GSDP, Pendency Rate)
Positively desired indicators (e.g., development expenditure) yield higher scores for higher values, while inversely desired indicators (e.g., debt) yield higher scores for lower raw values (Blanchard & Fischer, 1989). This dual normalisation ensures all indicators contribute consistently to the composite measure.
SKOCH State of Government Transformation Index
The SKOCH State of Government Transformation Index is a composite measure designed to capture the dual pillars of effective public administration: the quality of governance initiatives and the readiness and reach of digital infrastructure that enables service delivery at scale. It integrates two distinct yet complementary indices—the State of Governance Index and the State of e-Government Infrastructure Index—by assigning them equal weightage (50:50), thereby ensuring a balanced evaluation of both programmatic innovation and systemic digital capacity.
This equal-weighted aggregation reflects a foundational principle in public administration: good governance is not only about designing impactful programmes but also about delivering them efficiently and equitably at scale. By drawing on the State of Governance Index, the framework incorporates rigorous qualitative evaluation through expert assessment, peer reviews, field validation, and public perception. This ensures that states are recognised for launching novel, scalable, and high-impact initiatives—whether newly introduced or showing significant incremental improvement.
At the same time, the State of e-Government Infrastructure Index contributes a statistically grounded, quantitative layer to the evaluation. Based on standardised indicators across three pillars—Telecommunication Infrastructure, Human Capital, and Online Services—it captures the extent to which states are digitally equipped to support governance reforms. With Z-score normalisation and a weighted aggregation (25% for TII, 25% for HCI, and 50% for OSI), this index ensures that performance on digital readiness is robust, comparable, and sensitive to India’s federal diversity.
Why is this methodology is robust?
Integrative Assessment: Unlike standalone indices that examine either governance quality or digital capacity, this composite approach offers a holistic lens. It recognises that meaningful transformation in government occurs at the intersection of what is delivered (policy and programmes) and how it is delivered (through digital and institutional infrastructure).
Balance of Subjective and Objective Measures: The methodology combines the qualitative richness of expert and peer assessments (from the Governance Index) with the quantitative rigor of infrastructure-based indicators (from the e-Governance Index). This blend minimises the biases inherent in any single method and improves the credibility of rankings.
Innovation + Infrastructure: States that perform well on this index are not just those that have devised smart programmes, but also those that have created the digital backbone to execute and scale them. It ensures that innovation is not isolated but supported by structural capability.
Federal Sensitivity: The methodology is tailored to India’s federal structure, where states differ widely in institutional maturity and digital penetration. By combining outcome-driven programme assessment with variance-adjusted infrastructure measurement, the index remains sensitive to both early and mature adopters.
Policy Utility: For decision-makers, the State of Government Transformation Index provides a diagnostic and directional tool—showing where innovation exists, where infrastructure gaps lie, and where both align to deliver transformative governance.
SKOCH State of Government Efficiency Index
The SKOCH State of Government Efficiency Index is a composite metric that evaluates how effectively Indian states convert governance capacity into fiscally sustainable outcomes. It assigns equal weightage (50:50) to two foundational indices: the State of Governance Index and the State of Financial Prudence Index, thereby ensuring that the measurement of efficiency is grounded in both administrative performance and fiscal discipline.
This equal-weighted methodology reflects the principle that true efficiency lies not only in doing the right things (governance effectiveness) but also in doing them within the right means (fiscal prudence and sustainability).
Why is this methodology robust?
- Governance-Finance Integration: By fusing administrative performance with fiscal health, the index highlights states that are not only launching high-impact initiatives but are doing so without compromising long-term financial stability. It avoids rewarding populism at the expense of sustainability.
- Balanced Metric of Efficiency: The methodology treats governance quality (e.g., citizen-facing programmes, innovation, scalability) and fiscal soundness (e.g., debt, deficit, revenue mix, capital formation) as co-equal contributors to state efficiency. This ensures a more holistic and balanced assessment than traditional performance metrics.
- Bridges Execution and Resources: States often perform well in governance rankings by launching programmes, but these may be fiscally unsustainable. Conversely, states with strong fiscal numbers may under-deliver in citizen services. This index rewards alignment—where execution is matched by fiscal responsibility.
- Normalisation and Transparency: The underlying indicators in the State of Financial Prudence Index are normalised using min-max scaling with directional adjustments (i.e., higher debt = lower score), while the Governance Index relies on multi-layered scoring from expert, peer, field, and public evaluations. Together, they provide transparent, multidimensional insights into state performance.
- Policy Relevance: For policymakers, the State of Government Efficiency Index acts as a decision-support tool to identify best practices in governance that are both impactful and cost-effective. It helps highlight states that optimise value for money in public spending.
- Encourages Responsible Innovation: The index implicitly rewards those who pursue fiscally responsible innovation—programmes that are not just pathbreaking but also cost-effective, scalable, and sustainable in the long run.
SKOCH State of Development Index
The SKOCH State of Development Index is a comprehensive, multidimensional composite that captures the essence of development as the convergence of governance quality, digital infrastructure readiness, and fiscal health. It combines three foundational indices—
- SKOCH State of Governance Index
- SKOCH State of e-Government Infrastructure Index and
- SKOCH State of Financial Prudence Index
Some of the three Indices to create an integrated, evidence-based framework for evaluating the development trajectory of Indian states and union territories.
This equal-weighted composite reflects the understanding that sustainable development is not unidimensional. It requires visionary governance, enabling infrastructure and prudent financial management to generate long-term, inclusive growth outcomes. The methodology thus moves beyond traditional development measures that rely solely on GDP or welfare spending, offering a richer and more actionable benchmark.
Each component is independently constructed through robust methodologies:
- Governance is assessed via qualitative and impact-driven evaluations of projects, including expert reviews, peer assessments, field verification, and citizen perception.
- Digital Infrastructure is measured using normalised scores for telecommunication penetration, education (human capital), and usage of online public services.
- Fiscal Health is evaluated through debt levels, deficits, own-revenue generation, capital outlay, development expenditure, and institutional efficiency.
After normalisation and scoring within each component, the SKOCH State of Development Index aggregates the three with equal weights to ensure that no dimension disproportionately influences the final score.
Why is this the most robust methodology to measure development
- Multidimensional and Holistic
- Integration of Outcomes, Capacity and Sustainability
- Outcomes (impact of governance programmes),
- Capacity (digital and administrative infrastructure), and
- Sustainability (fiscal prudence and resource prioritisation). This alignment ensures that development is not only visible but viable over time.
- Combines Qualitative Depth with Quantitative Rigor
- Responsive to India’s Federal Diversity
- Actionable for Policymakers
- Incentivises Balanced Progress
Development is not merely about income or infrastructure—it is about how effectively a state delivers services, empowers citizens, sustains growth, and maintains macroeconomic stability. This index captures all these dimensions, offering a complete picture of a state’s development architecture.
While many indices focus on outputs or capacities in isolation, this methodology blends:
The methodology uniquely balances subjective, field-verified evaluation (State of Governance) with statistically standardised indicators (e-Governance and Finance), providing a well-rounded, unbiased measure of performance.
The index accounts for India’s federal complexity by using indicators that are sensitive to inter-state variations—in fiscal capacity, digital penetration, and governance models—making it contextually appropriate and policy-relevant.
This index serves not just as a diagnostic tool but also as a strategic compass for decision-makers. It highlights gaps across institutional, infrastructural, and financial pillars—enabling better targeting of reforms and resource allocation.
By giving equal weight to all three components, the methodology discourages one-dimensional development. A state cannot compensate for weak fiscal health with flashy governance projects, or for poor service delivery with digital connectivity alone. Progress across all dimensions is essential for better ranking.
Why Indices by SKOCH are Credible
One of the key strengths of the SKOCH indices lies in their subnational focus, which aligns closely with the federal structure of India. Unlike most global indices that are designed at the national level and fail to account for inter-state disparities, SKOCH indices are tailored specifically for Indian states and union territories. This design enables a more granular analysis of regional governance performance and provides actionable insights for state-level policy reforms and institutional improvements.
Another distinguishing feature of the SKOCH framework is its integration of both quantitative and qualitative evaluation methods. While global indices often rely heavily on perception-based surveys or top-down datasets, SKOCH indices incorporate expert assessments, peer reviews, field verification, and citizen feedback. The SKOCH State of Governance index, for instance, uses practitioner-level peer reviews and field visits, while the e-Governance and Finance indices rely on standardised, variance-adjusted statistics. This ensures a 360-degree validation process that captures both the design and real-world impact of public initiatives.
Crucially, the SKOCH indices emphasise outcomes rather than just inputs or procedural enablers. While global indices may focus on laws passed or services digitised, SKOCH goes further by measuring how these reforms translate into actual usage and impact—for example, through metrics such as e-transactions per capita or development expenditure as a percentage of GSDP. This shift from intentions to results makes the indices more reflective of on-ground realities and developmental progress.
The SKOCH indices are designed to be modular yet interoperable. Each of the six indices—State of Governance, State of e-Government Infrastructure Index, State of Financial Prudence Index and the three composites—can function independently, yet they can also be combined into multidimensional tools like the State of Government Transformation Index (Governance + e-Gov), State of Government Efficiency Index (Governance + Finance), and State of Development Index (Governance + e-Gov + Finance). This design allows for flexible benchmarking suited to different analytical or policy requirements.
Finally, SKOCH indices are built with direct policy utility in mind. While global indices are often geared toward international investors or academic researchers, SKOCH’s framework is deeply embedded in the Indian policy ecosystem. It provides relevant diagnostics for central ministries, the NITI Aayog, Finance Commission, state governments, and implementing agencies under the Digital India mission. This makes the indices not just tools of measurement but levers of meaningful governance transformation.
Table 2: SKOCH Indices Vs Global Indices
| SKOCH Index | Global Counterpart(s) | Comparison |
|---|---|---|
|
- World Bank’s Worldwide Governance Indicators (WGI) - UNDP Governance Indicators | WGI aggregates perception-based data from surveys and expert assessments but lacks granular project-level insight. The SKOCH index adds field validation, peer reviews, and distinguishes new vs ongoing programmes, offering real implementation insight. |
|
- UN E-Government Development Index (EGDI) - OECD Digital Government Index |
UN’s EGDI is skewed toward global benchmarks like open data and online portals. The SKOCH index is grounded in Indian realities, using tele-density, e-transactions, and human capital indicators, more reflective of India’s mobile-first ecosystem. |
|
- IMF’s Fiscal Transparency Evaluations - World Bank’s Public Expenditure and Financial Accountability (PEFA) |
Global fiscal indices emphasise transparency and compliance but often ignore development expenditure or governance efficiency. SKOCH’s inclusion of development spending, own-revenue mix, and judicial efficiency brings greater subnational depth. |
|
(No direct global equivalent; closest is WGI + EGDI composite) | Most global indices are siloed—focusing on either governance or infrastructure. The SKOCH composite is unique in combining institutional performance with digital infrastructure, giving a real-world view of scalable transformation. |
|
- World Bank Doing Business (discontinued) - IMF Fiscal Monitor + WGI (indirect) |
Unlike Doing Business, which captured procedural efficiency, SKOCH’s index captures institutional and fiscal efficiency together. It balances qualitative delivery assessment with quantifiable fiscal prudence, missing in global frameworks. |
|
- UN Human Development Index (HDI) - Global Competitiveness Index (WEF) |
HDI focuses on health, education, income—not governance or fiscal parameters. The WEF index includes infrastructure but lacks governance quality. SKOCH offers a more policy-relevant, tri-pillar framework blending governance, infrastructure, and finance. |
- Musgrave, R. A. (1959). The Theory of Public Finance: A Study in Public Economy. McGraw-Hill.
- Blanchard, O., & Fischer, S. (1989). Lectures on Macroeconomics. MIT Press.
- Lin, W., & Liu, C. (2000). On the government’s budget constraint: Evidence from panel data. Journal of Public Economics, 85(2), 253–278.
- Barro, R. J. (1990). Government spending in a simple model of endogenous growth. Journal of Political Economy, 98(5, Part 2), S103–S125.
- Aschauer, D. A. (1989). Is public expenditure productive? Journal of Monetary Economics, 23(2), 177–200.